 In my last post, I shared a script that will take a running trace and show you the XE events that it relates to, and what columns are available within those XE events. Specifically, this was for converting a deadlock trace into an XE session; however the process is the same for converting any trace into an XE session. In today’s post, we’ll compare the deadlock trace and the new XE output by running both, creating a deadlock, and comparing the captured data. We’ll look at the data captured in the XE from both script and GUI, and look at a few other differences between running a trace and an XE session.
The first step is to grab the trace and XE scripts from the prior post at https://sqlsolutionsgroup.com/wean-off-sql-profiler-part-1/. Modify both scripts to put the output files in an appropriate place on your system. Run both of the scripts to start the trace and to create the XE session. Next, start the XE session with the following script:
ALTER EVENT SESSION Deadlocks
ON SERVER
STATE = START;
The next step is to create a deadlock. Open up a new query window, and run the following. Leave this query window open.
USE tempdb;
GO
IF OBJECT_ID('dbo.Test1') IS NOT NULL DROP TABLE dbo.Test1;
IF OBJECT_ID('dbo.Test2') IS NOT NULL DROP TABLE dbo.Test2;
CREATE TABLE dbo.Test1 (col1 INT);
CREATE TABLE dbo.Test2 (col2 INT);
INSERT INTO dbo.Test1 VALUES (1),(2),(3),(4),(5);
INSERT INTO dbo.Test2 VALUES (1),(2),(3),(4),(5);
GO
BEGIN TRANSACTION
UPDATE dbo.Test1 SET col1 = col1*10 WHERE col1=3;
Next, open up a second query window, and run the following code in that window:
USE tempdb;
BEGIN TRANSACTION;
UPDATE dbo.Test2 SET col2 = col2*20 WHERE col2 = 4;
UPDATE dbo.Test1 SET col1 = col1*20 WHERE col1 = 3;
COMMIT TRANSACTION;
Finally, return to the first query window and run the following code, at which point one of the statements in one of the query windows will be deadlocked:
UPDATE dbo.Test2 SET col2 = col2*10 WHERE col2 = 4;
COMMIT TRANSACTION;Transaction (Process ID 57) was deadlocked on lock resources with another process and has been chosen as the deadlock victim. Rerun the transaction.
Now that we’ve created a deadlock, let’s compare the trace output data to the XE output data. First, let’s grab the data from the trace file with this script, which selects all of the non-null columns from the table valued function (remember to change the filename/path as appropriate):
SELECT t2.TextData, t2.BinaryData, t2.NTUserName, t2.ClientProcessID, t2.ApplicationName,
       t2.LoginName, t2.SPID, t2.Duration, t2.StartTime, t2.EndTime, t2.ObjectID,
       t2.ServerName, t2.EventClass, t2.Mode, t2.DatabaseName, t2.Type
FROM   sys.traces t1
CROSS APPLY sys.fn_trace_gettable (path, NULL) t2
WHERE t1.path LIKE 'C:\SQL\Traces\%'
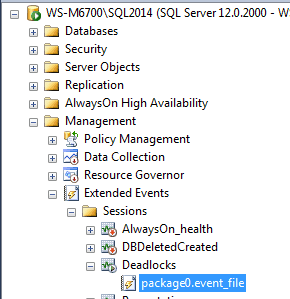
We now want to compare this to the data that was collected by the Extended Event session. In SSMS, expand the Management Tree, then the Extended Events tree, Session tree, and the Deadlocks tree:
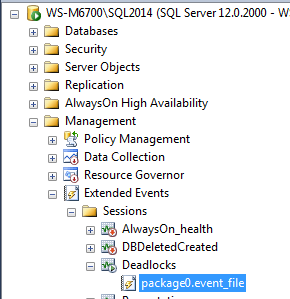
The event file target can now be seen. Double-click the file target to view the data, and you can see the events that fired for the deadlock. Note that you can right-click on the grid header, and choose additional columns to put into the grid – for this XE session, I like to add the database_name, resource_description, resource_owner, resource_type and xml_report columns.
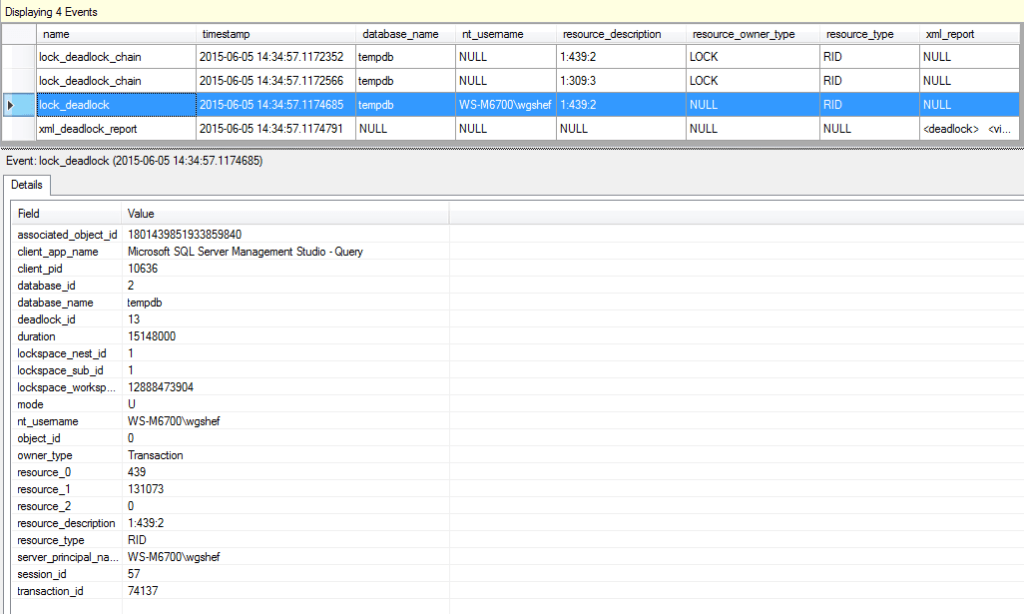
By selecting one of the rows, all of the data will be available in the lower grid in a Name/Value format.
Let’s compare the XE output to the trace output, and ensure that the data captured by the trace is present in the XE output. The first trace column is TextData. In that, we see multiple bits of data: SPID, lock resource, and the deadlock graph in XML format. In the XE, the resource_description column has the lock resource, the xml_report column has the deadlock graph in XML format, and the session_id column has the SPID. Skipping the BinaryData column, the next column is the NTUserName. Here we can see that this is collected in the XE nt_username column. A minor difference is that the XE includes the domain name, and the trace doesn’t.
The ClientProcessID column maps to the client_pid column. Likewise, the ApplicationName maps to client_app_name, LoginName maps to server_principal_name, SPID maps to session_id, Duration maps to duration, StartTime maps to timestamp, ObjectID maps to object_id. The EventClass, Mode and Type columns maps via friendly names to the name, mode and resource_type columns. The only columns that aren’t explicitly in the XE results are the BinaryData, EndDate and ServerName columns. The EndDate can be calculated from the timestamp and duration columns, and we could have selected the server_instance_name in “Global Fields (Actions)” tab when configuring the XE session. So here, we can see that everything needed from the trace is available in the XE session.
For the next step, one might want to load the data into a table, and viewing it in the viewer doesn’t allow for this. Or maybe you are working on a server prior to SQL Server 2012, and the GUI isn’t available for you to use. The following script can be used to query the data from the file target (again, remember to change the file name/path as necessary):
SELECT OBJECT_NAME,
       CONVERT(XML, event_data) AS event_data
FROM   sys.fn_xe_file_target_read_file('C:\SQL\XE_Out\Deadlocks*.xel', NULL, NULL, NULL);
As can be seen from the output, the data that we most want to see is stored as XML (when working with Extended Events, all of the data is stored as XML) in the event_data column, so I have converted this column to XML. At this point, you can click the XML output, and it will be opened up in text, allowing you to see all of the data as it is stored in the XML output.
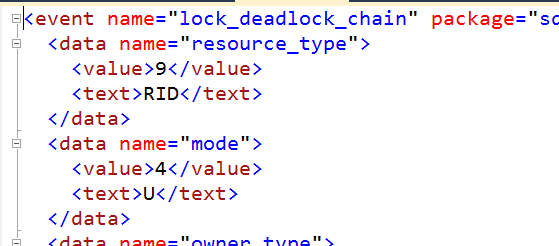
From this point, it’s just a matter of modifying the query to return the columns that you are interested in.
WITH cte AS
(
SELECT  t2.event_data.VALUE('(event/@name)[1]','varchar(50)') AS event_name,
        t2.event_data.VALUE('(event/@timestamp)[1]', 'datetime2') AS StartTime,
        t2.event_data.VALUE('(event/data[@name="duration"]/value)[1]', 'bigint') AS duration,
        t2.event_data.VALUE('(event/data[@name="database_name"]/value)[1]', 'sysname') AS DBName,
        t2.event_data.VALUE('(event/action[@name="nt_username"]/value)[1]', 'varchar(500)') AS nt_username,
        t2.event_data.VALUE('(event/data[@name="mode"]/value)[1]', 'varchar(15)')  + ' (' +
        t2.event_data.VALUE('(event/data[@name="mode"]/text)[1]', 'varchar(50)') + ')' AS mode,
        t2.event_data.VALUE('(event/data[@name="object_id"]/value)[1]', 'integer') AS OBJECT_ID,
        t2.event_data.VALUE('(event/data[@name="resource_description"]/value)[1]', 'varchar(max)') AS resource_description,
        t2.event_data.VALUE('(event/data[@name="resource_owner_type"]/text)[1]', 'varchar(max)')  AS resource_owner_type,
        t2.event_data.VALUE('(event/data[@name="resource_type"]/text)[1]', 'varchar(max)') + ' (' +
        t2.event_data.VALUE('(event/data[@name="resource_type"]/value)[1]', 'varchar(max)') + ')' AS resource_type,
        t2.event_data.VALUE('(event/action[@name="server_principal_name"]/value)[1]', 'varchar(max)') AS server_principal_name,
        t2.event_data.VALUE('(event/action[@name="session_id"]/value)[1]', 'varchar(max)') AS session_id,
        t2.event_data.VALUE('(event/action[@name="client_pid"]/value)[1]', 'integer') AS client_pid,
        t2.event_data.VALUE('(event/action[@name="client_app_name"]/value)[1]', 'varchar(max)') AS client_app_name,
        t2.event_data
FROM    sys.fn_xe_file_target_read_file('C:\SQL\XE_Out\Deadlocks*.xel', NULL, NULL, NULL) t1
CROSS APPLY (SELECT CONVERT(XML, t1.event_data)) t2(event_data)
)
SELECT  cte.event_name,
        cte.StartTime,
        DATEADD(MICROSECOND, duration, CONVERT(DATETIME2, [cte].StartTime)) AS EndDate,
        cte.duration,
        cte.DBName,
        cte.nt_username,
        cte.server_principal_name,
        cte.mode,
        cte.OBJECT_ID,
        cte.resource_description,
        cte.resource_owner_type,
        cte.resource_type,
        cte.session_id,
        cte.client_pid,
        cte.client_app_name,
        cte.event_data
FROM    cte;
This query extracts the data from XE file target. It also calculates the end date, and displays both the internal and user-friendly names for the resource_type and mode columns – the internal values are what the trace was returning.
For a quick recap: in Part 1, you learned how to convert an existing trace into an XE session, identifying the columns and stepping through the GUI for creating the XE session. In part 2 you learned how to query both the trace and XE file target outputs, and then compared the two outputs and learned that all of the data in the trace output is available in the XE output.

