When working with SQL Server, one of the best tools DBA’s can use for diagnosing performance issues is wait statistics (or wait stats for short). But what exactly are they, and how are you supposed to interpret them? In this guide, I’ll break down what wait stats are, why they matter, and how to use them to troubleshoot performance problems.
Thank you to our SQL Server Expert and Senior DBA, Rich Benner for providing the valuable Technical info behind this blog. To learn more about Wait Statistics from Rich, check out his recent webinar and two new YouTube videos- an explainer and a demo, on our channel.
What Are Wait Stats?
Anytime something inside Microsoft SQL Server is waiting for a resource, it’s assigned a wait stat. For example:
-
A query waiting for CPU or memory resources
-
A query waiting to access a data object like a data page or table
-
An internal SQL Server process waiting to complete a task
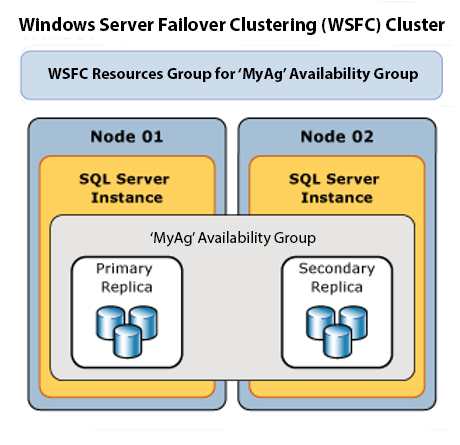
Some waits are completely normal. For example, in Availability Groups, certain threads simply wait to synchronize data with secondary nodes. That’s expected behavior and not necessarily a sign of trouble.
Key Things to Know About Wait Stats
-
They’re cumulative – Wait times are aggregated since the last time the data was cleared, usually at the last server restart (though other events can reset them).
-
They measure time in seconds or milliseconds – depending on the stat you’re viewing.
-
They’re invaluable for troubleshooting – By looking at wait stats, you can quickly zero in on what’s slowing down your system.
How to Find Wait Stats
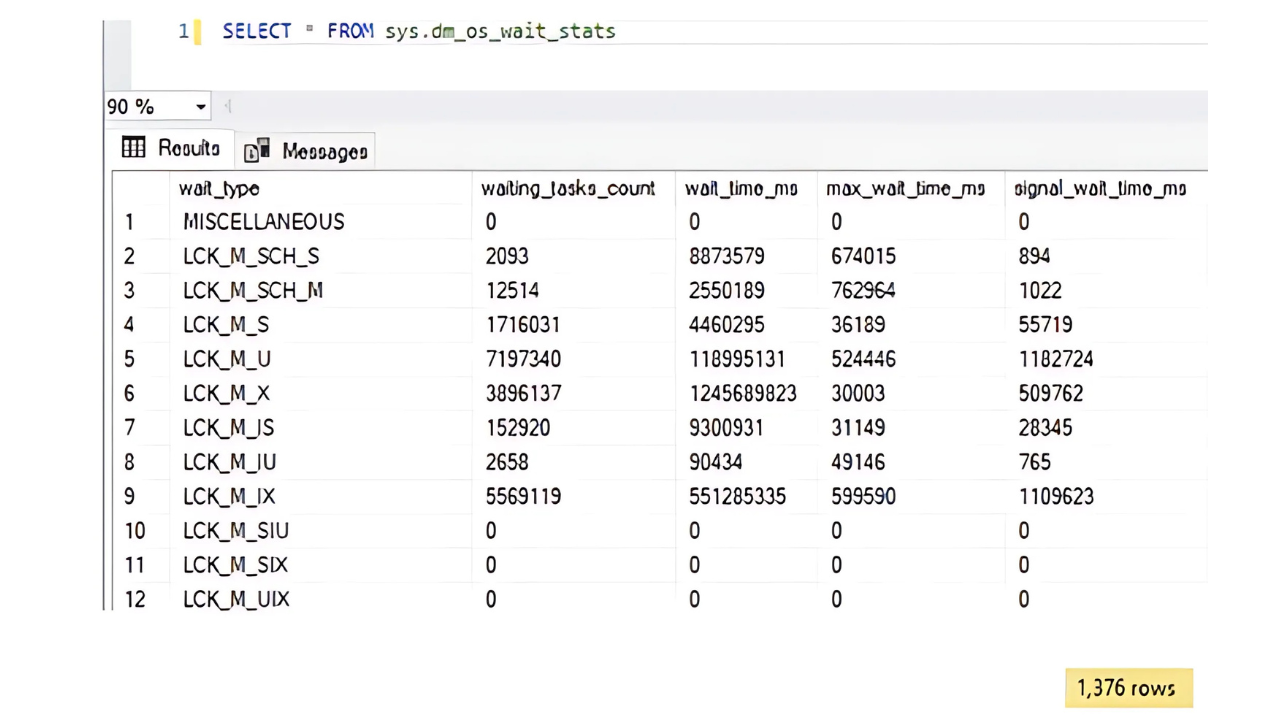
The primary DMV for retrieving wait stats is:
SELECT * FROM sys.dm_os_wait_stats;
On a SQL Server 2022 instance, you might see over 1,300 different wait types. Even seasoned DBAs only know a fraction of them by heart. That’s where resources like the SQLskills Wait Types Library come in handy. This community-maintained list covers around 95% of known waits, detailing whether they’re benign or problematic and suggesting possible resolutions.
Useful Tools for Analyzing Wait Stats
-
sp_WhoIsActive – An enhanced version of sp_who2 that shows what queries are running, their process IDs, and any current waitss.
-
sp_BlitzFirst – A free tool that captures your current wait stats along with other diagnostic information.
-
Custom Queries – Many DBAs have their own scripts for retrieving & formatting wait stats. A quick search for “Wait Stats query” will yield plenty of examples.
The Top 5 Most Common Wait Types
1. LCK_* – Lock Waits
Occurs when one query locks a resource (e.g., a data page) and another query has to wait for it to be released. Example: An UPDATE query locks a row, preventing a SELECT query from reading it until the update completes.
2.
CXPACKET / CXCONSUMER
– Parallelism Waits
Happens when a query is split across multiple CPU cores. If one thread finishes before the others, it waits for the slowest one to catch up. Normal in moderation, but excessive CX waits can indicate an inefficient parallelism setup.
3.
ASYNC_NETWORK_IO
– Application Processing Delays
Indicates SQL Server has finished processing results but is waiting for the application to consume them. Often caused by applications retrieving rows one at a time instead of in batches.
4.
LATCH_* and PAGE_LATCH_* – Structure & Page Locks
-
LATCH_*: Locks on internal structures (not data pages)
-
PAGE_LATCH_*: Locks on data pages themselves. These can signal contention in memory structures or data access patterns.
5.
WRITELOG
– Transaction Log Bottlenecks
This occurs when SQL Server is waiting to write to the transaction log. Common causes include slow disk performance, excessive write activity, or log file contention.
Why Wait Stats Matter
Wait stats provide a high-level overview of where SQL Server is spending its time waiting.
They help you answer questions like:
-
Is my performance issue due to locking, disk speed, or parallelism?
-
Is the problem in SQL Server or in the application consuming data?
-
Are my hardware resources (CPU, memory, storage) configured optimally?
By combining wait stats with tools like sp_WhoIsActive and sp_BlitzFirst, you can pinpoint bottlenecks faster and focus your tuning efforts where they’ll make the biggest impact. Not all waits are bad — many are just part of normal SQL Server operations. The key is knowing which waits are worth investigating and which you can safely ignore. With a solid understanding of wait stats, you’ll be better equipped to diagnose issues, improve query performance, and keep your SQL Server running smoothly.
Need help interpreting your wait stats?
At SQL Solutions Group, we work with clients every day to identify and fix performance issues. Contact us for a health check and start optimizing your environment today.

