Strangest Things Pt 2: 505 executions per second
I’ve been a SQL Server DBA for more than 20 years and have spent the last 10 of those consulting. When you’ve been doing this for as long as I have, there’s not a lot of new issues that come up that you haven’t seen before. Which is why we came up with this idea for the blog series (admittedly riffing off of the Stranger Things Netflix show). We’ve seen a lot of crazy stuff in SQL over the years, too, and here’s our first look at one of the strangest things.
Most of the time issues that come up with our clients are old hat for us, even if they are very perplexing to the customer. That doesn’t mean we’re smart and you’re dumb … we’ve just seen it a million times before, like these oldies but goodies:
- Cannot Generate SSPI context when connecting to SQL Server? That’s a Kerberos / SPN issue.
- Your differential backup is 80% the size of your full backups after just one day? Index fragmentation (usually caused by a GUID as a clustering key).
- Users complaining that a query that usually returns quickly occasionally takes forever or times out? Excessive blocking problems.
- Inconsistent results/phantom bugs in data that you can’t figure out? My nemesis, NOLOCK
- High end hardware but performance is still not where you think it should be? Misconfigured software–VMWare, Windows, SQL Server – are all culprits.
Occasionally, though, something new comes along that, dare I say it, turns things upside down. Recently, a vendor upgraded their software at a client and the database server immediately spiked to 80% CPU utilization on a continuous basis. Of course, the vendor immediately blamed hardware (which was laughable), but I digress. Digging into the issue, it became clear what the problem was.
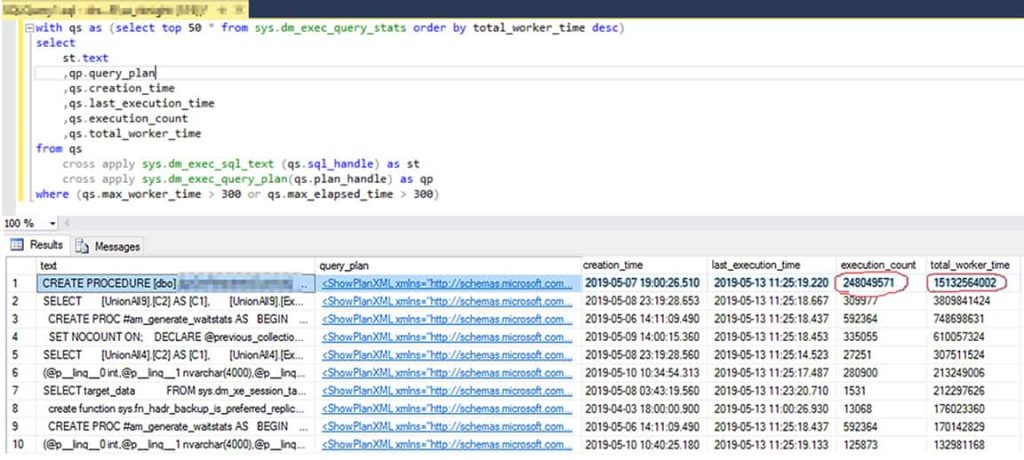
First step is to take a look at query stats:

It doesn’t take an expert to see that the very first query plan is the culprit. Nothing else is even close in terms of execution count or worker time.
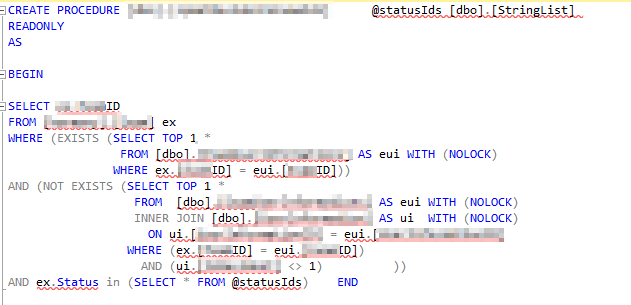
The next step was to dig into that query. The stored procedure in question looks like this:

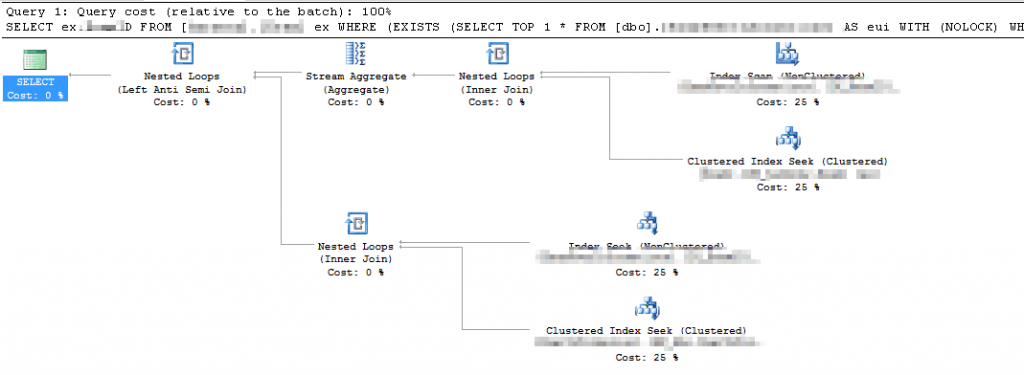
Pretty simple proc, right? What does the execution plan look like?

Still good. In fact, each execution of this stored procedure was less than 500 logical reads.
The problem is the execution count. There were over 248 million executions of this proc since the plan was compiled (10 hours in this case).
| Total executions | 248,049,571 |
| Total minutes | 8,185 |
| Executions per minute | 30,305 |
| Executions per second | 505 |
That’s an execution every 2 MILLISECONDS.
So what is this proc doing that would require it to run so often? This is a health care system that receives new records via HL-7 throughout the day. The developer said this proc is called by a service (which is clearly heavily multi-threaded) that polls the table to see if there are any new records. There are approximately 1,000 records added per day in this environment. This proc is total overkill.
A Better Option
The short-term solution to this was to get the vendor to dial the polling interval down to once per minute (which is probably still more often than needed) which reduced the executions from 30,000 / minute to 1 /minute. In other words, 1/30000th of the resources it was using before.
But there are even better, less impactful ways to do something like this. Rather than polling for new records, why not do this in an event-driven way, where the database server notifies the app when there is a new record? A simple solution would be SQL Server Query Notifications which use Service Broker to tell the app when the underlying data has changed.
This is a great example of developers not thinking about the impact on database resources when writing code. Truly one of the strangest thing, and we’ll look at another specimen soon.


