I am very grateful for the career I have passionately pursued these last 20 years, working for small, medium, large, and enterprise companies around the world. I have been a consultant in the database realm for most of those 20 years, solving everything from simple to very complex data puzzles that have given me a joy far better than any other profession I can think of to-date. SQL data analysis is a challenge I enjoy.
It seems to be true that you really excel in what you love, so do what you love as a career and you will love life.
Work/Life Balance
Still, after a number of years, no matter how much you love your job, fatigue and burnout can come up on you if you do not have balance in your life. Some people spend quality time with their families, some volunteer and support their community, and then others, like myself, dive into a hobby that allows one’s mind to rest from the data problems of the world. I got into triathlon in a successful attempt to quit some bad habits and start a health journey through competition with myself. For several years I set goals and crushed them as I worked into a healthier lifestyle that also allowed me to focus more while at work.
For the last couple of years I have not been able to do much physical activity because of an accident. But this year I have been feeling stronger, so I ventured back out on my bicycle to remove a few pounds I have earned sitting in recovery. I would love to run, but the impact is just too much at this stage and it can be hard to find a pool to swim in during the current pandemic. So I have put all of my effort into getting comfortable riding long distances again.
Back in the Saddle
I set goals and, without pain, was able to reach them quickly. Before long, my mind started to ponder the idea of competing again, maybe in just some bicycle specific races. Contemplating the decision to compete or not comes with the vision of failure, possibilities of embarrassment, and the fearful thought of another injury. While these emotions should not keep a person from achieving their goals, one should not rush off too soon for something they are not ready for, as it could come with dire consequences.
When this type of decision lays before you there is really only one way to go forward and that is to weigh your options without bringing your emotions into the topic, and the only way to do that is by crunching data because the data never lies. This is where the SQL data analysis comes in handy.
Identifying the Data
It just so happens crunching data is right in our wheelhouse, so the first thing we need to do is find out what data is available. Like running, swimming, golf, and just about every other sport, there are metrics we can capture, save, aggregate, analyze, and report on. In the cycling world, some of these metrics are:
- Heart Rate
- Speed and Distance over Time
- Cadence (How many times you pedal a full rotation in one minute)
- Watts (Joules converted by an algorithm to represent how much power is being pushed)
Most sport hobbies have devices to capture and store metrics and cycling is no exception, with many to choose from. My wife and I use Garmin products that have a “bike computer” called an “Edge” that, when synced with my home computer, sends my ride information to a web application called Garmin Connect. There are others like Polar, Training Peaks, and even Strava web applications that could be used to do the exact same thing and with several other sports.
My preference is Garmin so that is what we will collect our base data from. Once you save an activity to the computer, you can export that activity from your bike computer or from the web application itself in the form of what’s called a TCX file, which is really just an XML file that will have all of your raw data that can be exported into your SQL Server if so desired.
Crunching The Data
We will tackle this effort in future posts in this series, but right now we will be working on a simpler solution first, and then put it all together down the road. Most web applications that import your activity data have rolled up data ready for export in a nice, clean CSV file. What these sites don’t do well is slice and dice the data against other efforts in the specific way you want to see it. Therefore, we are going to import a simple file and run some simple queries against it to give us an idea of how much better/or worse one has achieved through a season of activities in training — in this case, cycling.
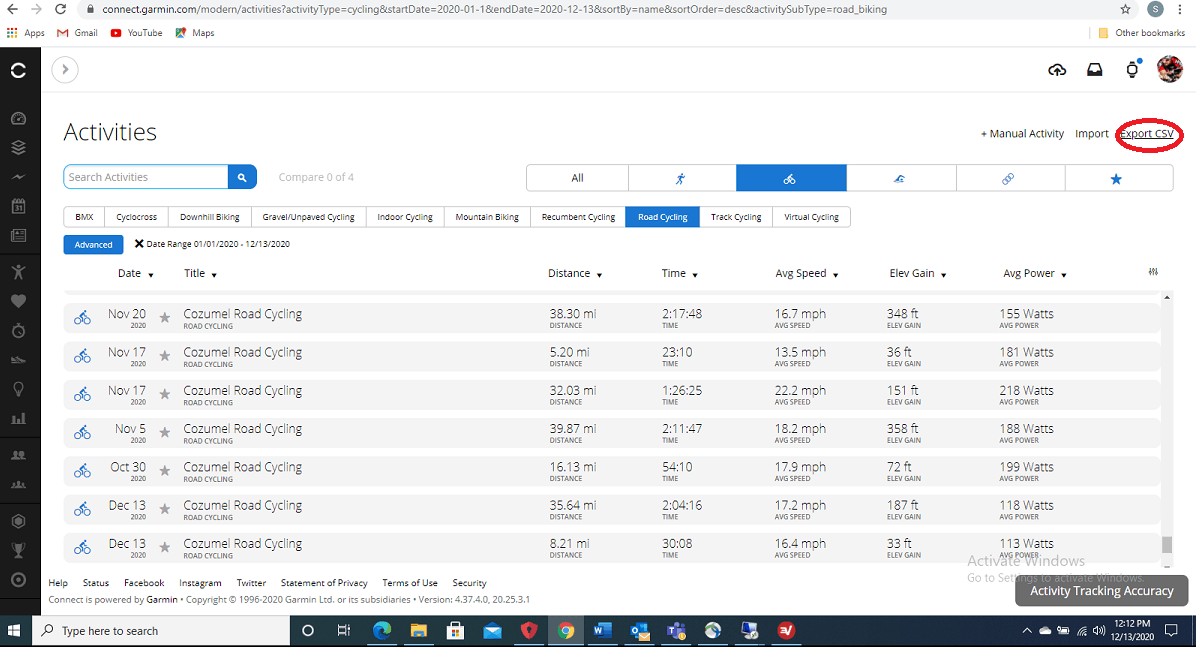
The first step is to get the data Garmin has already provided in a simple format from their site at GarminConnect.com. Once you login, you can search your activities from the dashboard, filter the activities you want, and then export that into a CSV file by clicking on the export link in the upper left-hand corner as shown below:
Once you have saved the data locally, import it into SQL Server. In my opinion, it is much easier to just import the data as String data into a table and then convert it once we have it inside SQL, with just the columns we want in the data format we want, such as:


SELECT [Activity Type]				AS [Activity]
,CONVERT(DATETIME, [DATE])				AS [StartDate]
,[Title]
,CONVERT(FLOAT, [Distance])				AS [Distance]
,CONVERT(INT, REPLACE([Calories], ',', ''))	AS [Calories]
,CONVERT(TIME, CONVERT(DATETIME, [TIME]))	AS [MovingTime]
,CONVERT(INT, REPLACE([AVG HR], '--', ''))	AS [AvgHR]
,CONVERT(INT, REPLACE([MAX HR], '--', ''))	AS [MAXHR]
,CONVERT(FLOAT, [AVG Speed])			AS [AvgSpeed]
,CONVERT(INT, REPLACE([AVG Bike Cadence], '--', ''))		AS [AvgCad]
,CONVERT(INT, REPLACE([Normalized POWER® (NP®)], '--', ''))AS [PowerNorm]
,CONVERT(INT, REPLACE([MAX AVG POWER (20 MIN)], '--', ''))	 AS [Max20Power]
,CONVERT(INT, REPLACE([AVG POWER], '--', ''))			 AS [AvgPower]
  INTO bikedata_Summary
  FROM bikedata
  ORDER BY [StartDate]
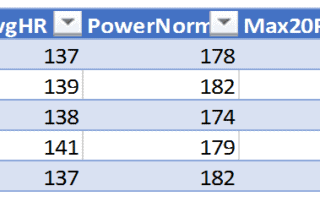
Now that we have the summary data in SQL the way we want it (in a way we can aggregate with system math functions), let’s take a quick look at what we have. Since looking at each individual activity may not help us, we will group the data by week and look at the numbers to see what happens each week over the course of several months.
SELECT DATEPART(WEEK, [StartDate])  AS [Week]
	  ,SUM(Distance)               AS [Miles]
	  ,AVG(AvgSpeed)               AS [Speed]
	  ,AVG(AvgHR)                  AS [AvgHR]
	  ,AVG(PowerNorm)              AS [PowerNorm]
	  ,AVG(Max20Power)             AS Max20Power
	  ,SUM(Calories)               AS [CaloriesBurned]
      ,COUNT(1)                     AS [Number_Of_Activities]
  FROM bikedata_Summary
 GROUP BY DATEPART(Week, [StartDate])
 ORDER BY [Week]
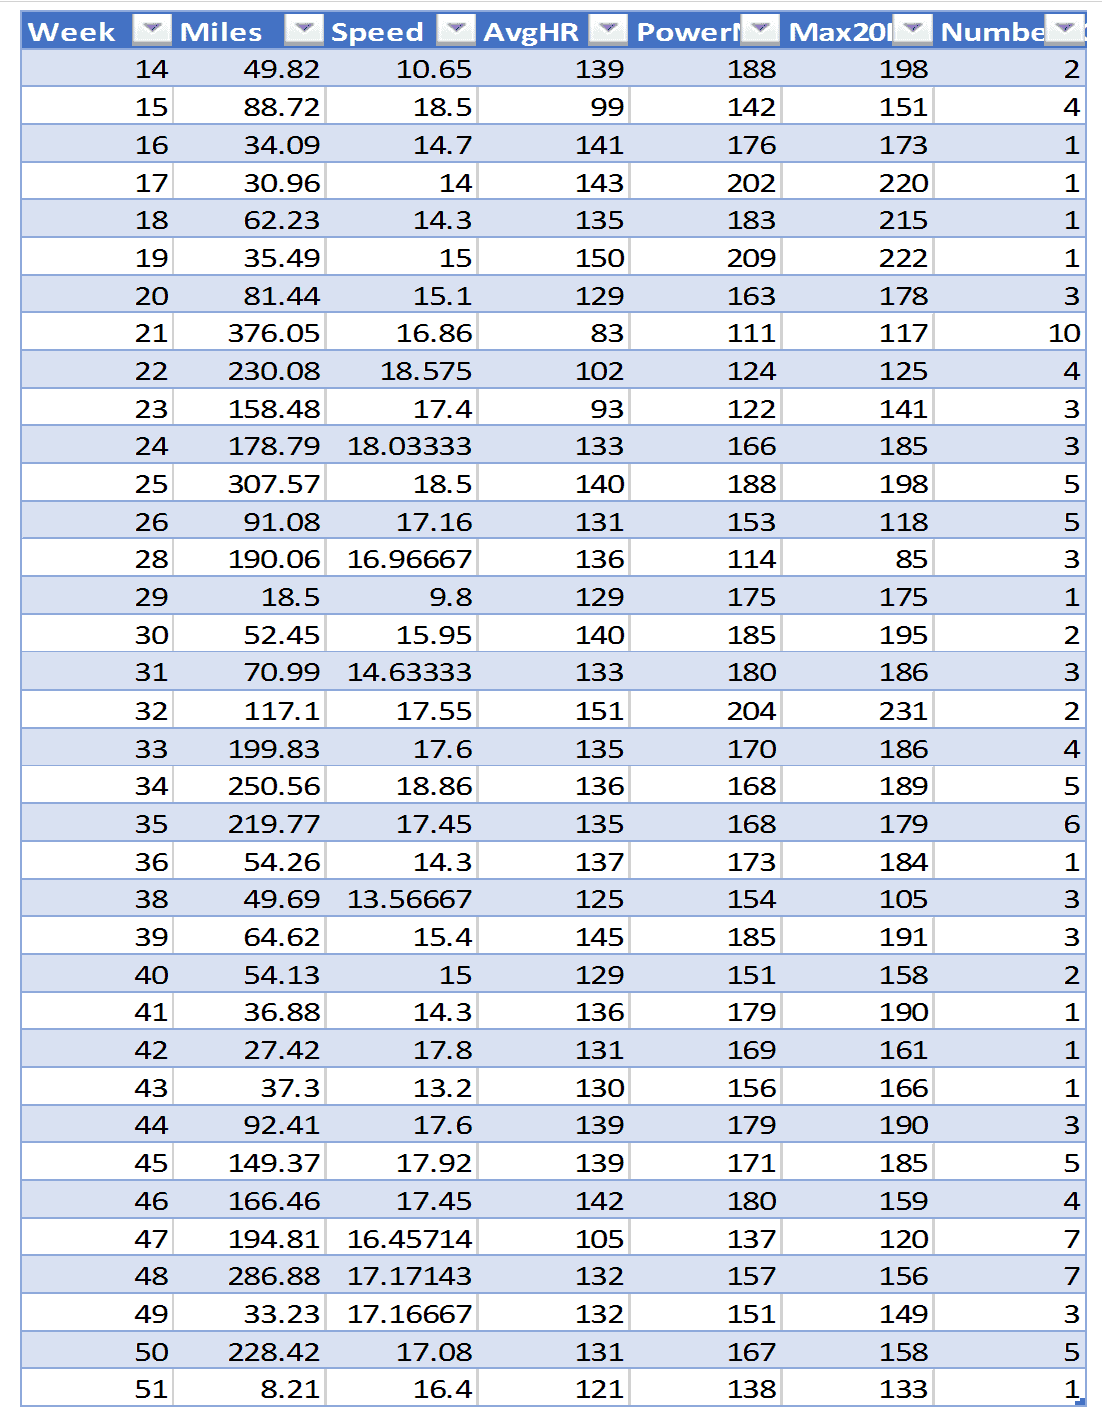
At first look, if we skip the speed and go right to the Avg Normalized Power, it appears that I may have a slight increase in power if not anything but more consistency. While we do have numbers that stretch across several months, it is hard to determine how much we have improved because some of these activities occurred in Nevada, Utah, Texas, and Cozumel. These are variables in the data.
Oranges to Oranges
To really look at the performance objectively, we need to pick a single course that was done repeatedly throughout the year and focus on that, which for me would be the Cozumel course. Some of the data is just riding around town to do errands, and not specific training, so we filter out any distances that are very short to get a better idea of the numbers, now that we can compare oranges to oranges. With our filters the query looks more like this:
SELECT DATEPART(WEEK, [StartDate]) AS [Week]
	  ,SUM(Distance)               AS [Miles]
	  ,AVG(AvgSpeed)               AS [Speed]
	  ,AVG(AvgHR)                  AS [AvgHR]
	  ,AVG(PowerNorm)              AS [PowerNorm]
	  ,AVG(Max20Power)             AS Max20Power
	  ,SUM(Calories)               AS [CaloriesBurned]
      ,COUNT(1)                    AS [Number_Of_Activities]
  FROM narc_Hold..bikedata_Summary
 WHERE [Title] LIKE '%Cozumel%'
   AND [AvgHR] > 0
   AND [Distance] > 15
 GROUP BY DATEPART(Week, [StartDate])
 HAVING SUM(Distance) > 150
 ORDER BY [Week]
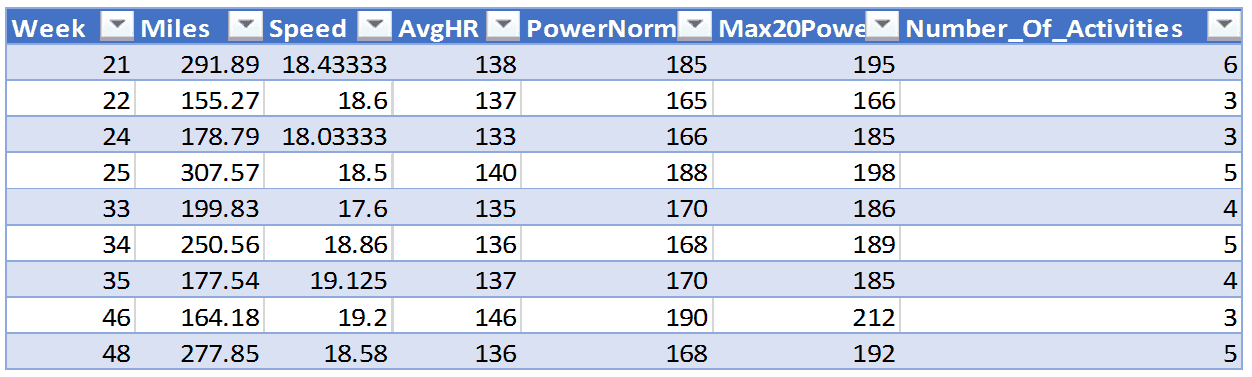
Looking at these numbers, we can see that my speed has gone up ever so slightly, and the numbers for power are maybe a little better but not as much as I would expect after a year of training. Let’s look at a bigger picture by taking the same query and grouping by month instead of week.
SELECT DATEPART(MONTH, [StartDate]) AS [MONTH]
	  ,SUM(Distance)               AS [Miles]
	  ,AVG(AvgSpeed)               AS [Speed]
	  ,AVG(AvgHR)                  AS [AvgHR]
	  ,AVG(PowerNorm)              AS [PowerNorm]
	  ,AVG(Max20Power)             AS Max20Power
	  ,SUM(Calories)               AS [CaloriesBurned]
      ,COUNT(1)                    AS [Number_Of_Activities]
  FROM bikedata_Summary
 WHERE [Title] LIKE '%Cozumel%'
   AND [AvgHR] > 0
   AND [Distance] > 15
 GROUP BY DATEPART(MONTH, [StartDate])
 HAVING SUM(Distance) > 150
 ORDER BY [MONTH]
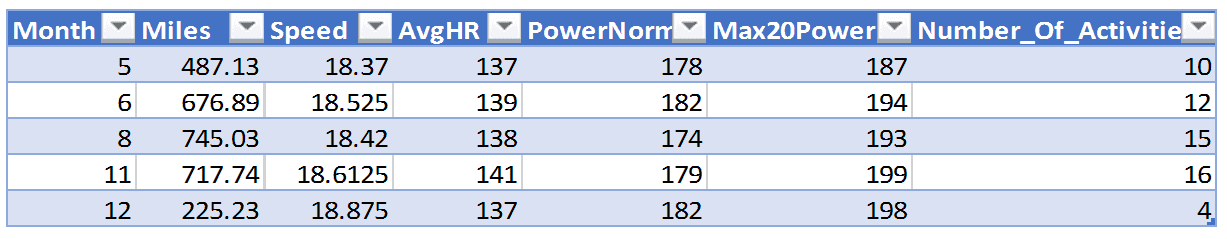
When we look at the data grouped by month, we can now see a small, .5 MPH speed gain, and looking at both power and 20 min max power we can see that I have gained a little over 10 Watts of power, which is nice but my expectations were much higher. This is one of the real take-aways from this segment: The client (in this case me) has a vested interest in what their perception and hope of the final analysis will be, while the data engineer looks only at the data in black and white.
Although you can approach the data in an unbiased, unemotional way, make sure you have looked at the data completely, such as above when we looked at weekly and monthly views.
Further Refinements
Now, let’s take one more thing into consideration. When I ride, I start my Garmin when I leave my house and I have to pedal through town cautiously. This skews both the speed and the power averages because I spend a lot of time getting out of town and my Garmin stops automatically when I go slower than 6 MPH, so we do not know how much time in these rides is tied up in getting through town.
For a more accurate view, I should start the analysis when I’m out of town in the training zones. I could do this by looking at the latitude/longitude data and look at the metrics from a certain geographical mark which will tell me when the training has actually started and stopped. Unfortunately, we will not be able to do that with summary data; we will need much more detailed data that we will get from the raw TCX files. That will be a little more work, but we can then really drill down surgically to see if I have indeed made any improvements through the year or not.
In the next segment, we will tackle the challenge of importing these XML files and turning the data into something we can report on.


