

A query that used to run in seconds suddenly takes minutes. Users complain that an application is slow, a report takes forever to load, or a critical process is missing its deadline. The natural reaction is to start changing indexes or rewriting the query—but effective SQL Server query tuning starts with understanding why the query is slow before changing anything. This SQL Server query tuning walkthrough will help you diagnose and fix your slow queries.
Query tuning is a process of identifying the cause of poor performance, making a targeted change, and then measuring the results. Tools such as Query Store, execution plans, Dynamic Management Views (DMVs), and SQL Server performance metrics can help identify whether the problem is caused by a query, execution plan, indexing, statistics, blocking, resource pressure, or another factor.
This walkthrough demonstrates a practical approach to diagnosing and tuning a slow SQL Server query. The goal is to understand why it was slow and verify that the change actually improved the workload.
A Practical SQL Server Query Tuning Process
A good query-tuning process looks something like this:
- Confirm and reproduce the performance problem
- Find the query and establish a baseline
- Use Query Store to examine historical behavior
- Review the execution plan
- Examine performance metrics and waits
- Identify the root cause
- Apply a targeted fix
- Test the change
- Compare the results against the baseline
- Monitor the query after the change
Let’s walk through each step.
1. Confirm the Performance Problem
Before changing anything, make sure you understand the problem. “SQL Server is slow” isn’t specific enough to begin tuning.
Determine:
- Which query or workload is slow?
- How long does it normally take?
- How long does it take now?
- Is it always slow or only sometimes?
- When did the problem begin?
- Did anything change around that time?
- Are other queries experiencing similar problems?
- Are users actually affected?
For example, suppose a query normally completes in about two seconds but is now taking 45 seconds. That’s a useful starting point.
If the query has always taken 45 seconds, you may have a performance problem, but you don’t necessarily have a performance regression. If it previously took two seconds, something has changed. That distinction can significantly affect the investigation.
2. Find the Query
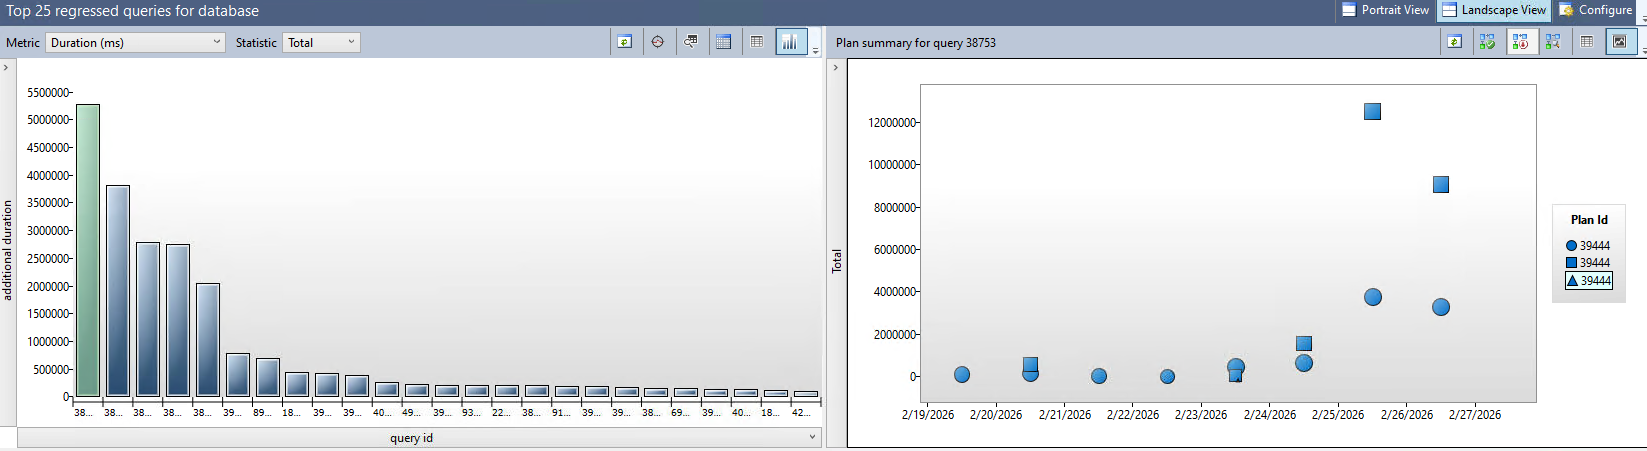
Once you’ve confirmed the problem, identify the details of the query responsible for the performance issue.
There are several ways to do this, depending on the situation. You might already have:
- The query from an application developer
- An error or timeout message
- A slow report
- A stored procedure
- A SQL Server Agent job
- Information from a monitoring platform
If the problem is less obvious, Query Store is often an excellent place to start.
Establish a Baseline
Once you’ve identified the query, record its current behavior before making any changes.
Depending on the situation, capture:
- Execution duration
- CPU time
- Logical reads
- Physical reads
- Execution count
- Execution plan
- Wait statistics
- Blocking
- Application response time
These measurements give you something to compare against after the change. Don’t tune first and measure later. Without a baseline, you may not know whether your change actually helped.
3. Use Query Store to Investigate Historical Performance
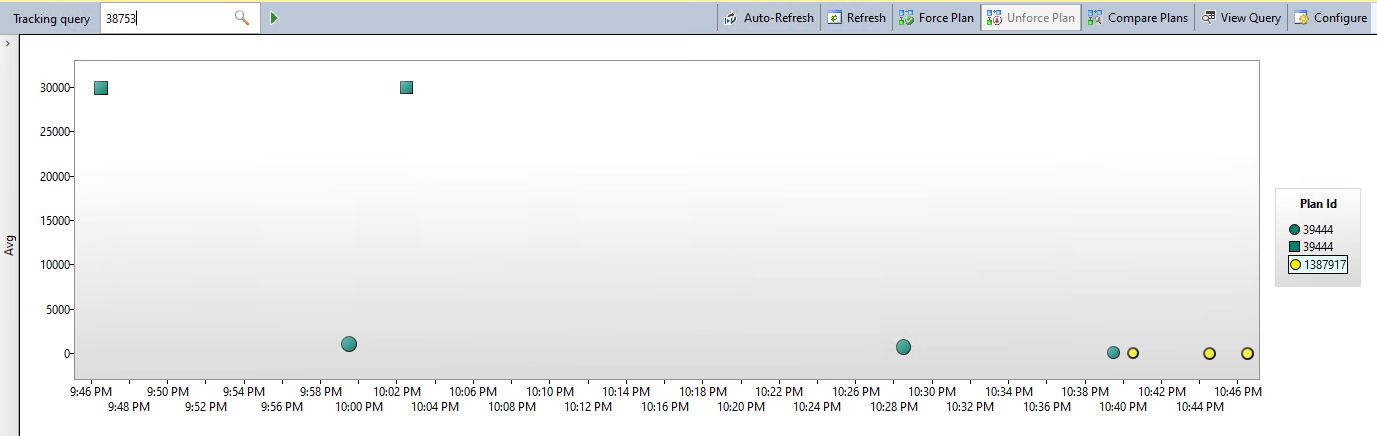
Query Store is one of the most useful tools for understanding how query performance changes over time. Unlike looking at a query only when it is currently running, Query Store can provide historical information about query execution and plans.
This makes it particularly valuable when a query:
- Used to be fast
- Recently became slow
- Is intermittently slow
- Has multiple execution plans
- Performs differently under different conditions
In SQL Server Management Studio, you can access Query Store through the database’s Query Store node.
Look for Performance Changes
When investigating a slow query, look at its historical execution information.
Useful measurements include:
- Average duration
- CPU time
- Logical reads
- Execution count
- Query plan changes
The key question is: Did the query’s performance change, and if so, what changed with it?
For example, imagine the following pattern:
| Period | Average Duration | CPU | Logical Reads |
| June | 1.8 sec | 1.2 sec | 12,000 |
| July | 38 sec | 31 sec | 2,400,000 |
That’s a significant change. Your next question should be: “Why is the query doing so much more work?”
4. Compare Execution Plans
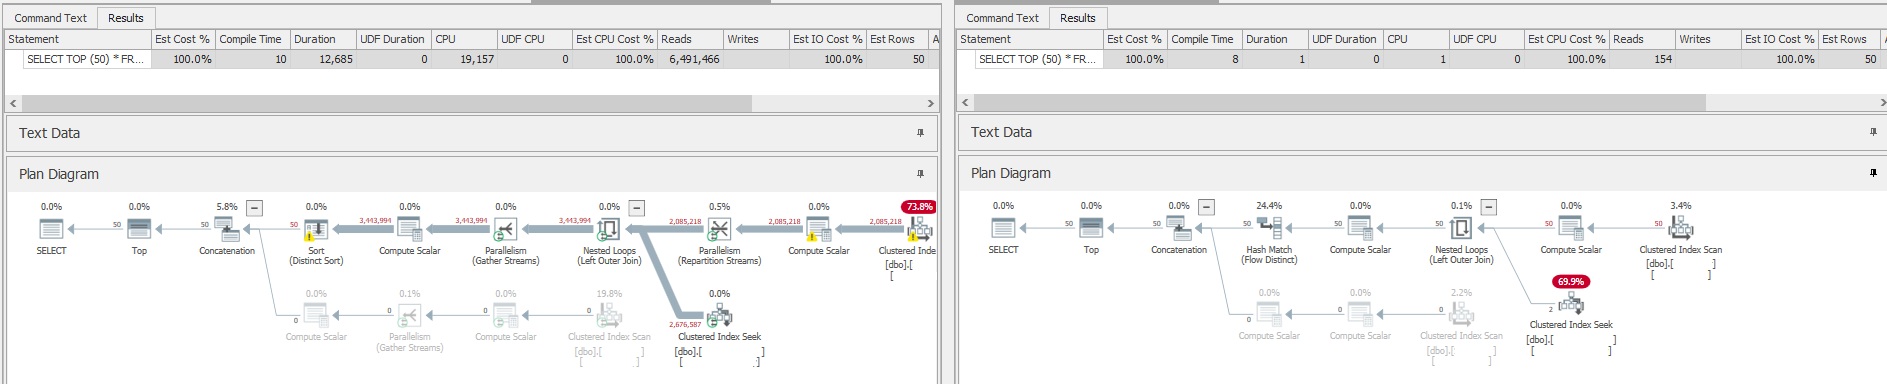
Once you’ve identified a query that has changed, examine its execution plan. An execution plan shows how SQL Server intends to retrieve and process the data required by a query.
Execution plans can reveal:
- Table scans
- Index scans
- Index seeks
- Expensive operators
- Sort operations
- Hash operations
- Key lookups
- Join strategies
- Estimated versus actual row counts
- Parallelism
- Memory grants
- Other potential bottlenecks
If Query Store shows that a query previously used one plan and now uses another, comparing those plans can be particularly revealing.
Look for the Difference, Not Just the “Expensive” Operator
Execution plans often highlight operators with high estimated costs. That information is useful, but don’t automatically assume the operator with the highest percentage is the root cause.
Instead, ask: What is this operator doing, and why is SQL Server doing it?
For example, a large table scan may be perfectly reasonable if the query needs most of the table’s rows. A scan becomes interesting when SQL Server is reading millions of rows to return a handful.
That may point toward:
- Missing or ineffective indexes
- Poor filtering
- An inaccurate cardinality estimate
- Query design
- Outdated statistics
- Other factors
5. Check Estimated vs. Actual Rows
One particularly useful clue in an execution plan is the difference between estimated rows and actual rows. SQL Server uses statistics and other information to estimate how many rows an operation will produce.
If SQL Server estimates 100 rows but actually processes 5 million, the optimizer is working with very different information from reality. That can lead to an inefficient execution plan.
Large discrepancies can point toward issues involving:
- Outdated statistics
- Data distribution
- Predicates
- Parameter sensitivity
- Cardinality estimation
- Query design
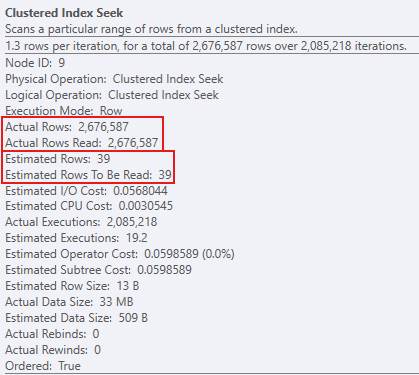
The important point is that an inaccurate estimate isn’t necessarily the root cause by itself. It is evidence that tells you where to investigate further.
6. Look at Key Performance Metrics
Execution plans aren’t the only source of evidence. Look at the query’s performance metrics and compare them with your baseline.
CPU Time
High CPU consumption can indicate that the query is performing substantial processing. Look for changes from the query’s normal behavior rather than assuming that any particular CPU value is automatically bad.
Logical Reads
Logical reads indicate how many pages SQL Server reads from the buffer pool. A query that suddenly goes from thousands of logical reads to millions deserves investigation. High logical reads can be associated with:
- Table scans
- Inefficient indexes
- Poor filtering
- Inefficient joins
- Query design
Query Duration
Duration tells you how long the query takes to complete. Compare the current duration with historical performance and consider whether the query is actually affecting users or business processes.
Wait Statistics
Wait statistics can help explain where SQL Server is spending time waiting. Depending on the workload, you may see waits associated with:
- CPU
- Storage I/O
- Locking
- Memory
- Parallelism
- Other resources
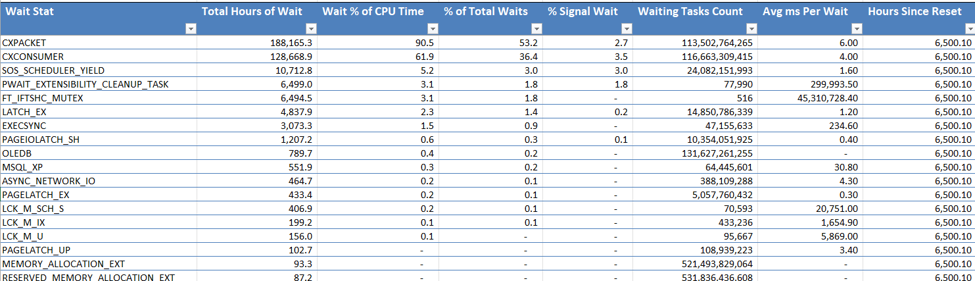
The important thing is to look at these metrics together. A query with high duration, high logical reads, and increased CPU consumption tells a different story from a query with high duration but relatively little CPU and significant lock waits.
7. Check for Blocking
Before assuming the query itself is inefficient, determine whether it is simply waiting for another session.
Blocking occurs when one session holds a lock that prevents another session from proceeding. A query can therefore appear slow even when its execution plan is perfectly reasonable.
Check for:
- Blocking sessions
- Duration of blocking
- Number of affected sessions
- Transactions holding locks
- Whether the blocking is recurring
Tools such as sp_WhoIsActive can provide a useful real-time view of active sessions, blocking chains, waits, and other information that can help identify the source of a problem. You can also go straight to the source and read the underlying DMVs using SSMS if you’d like to do it the hard way.
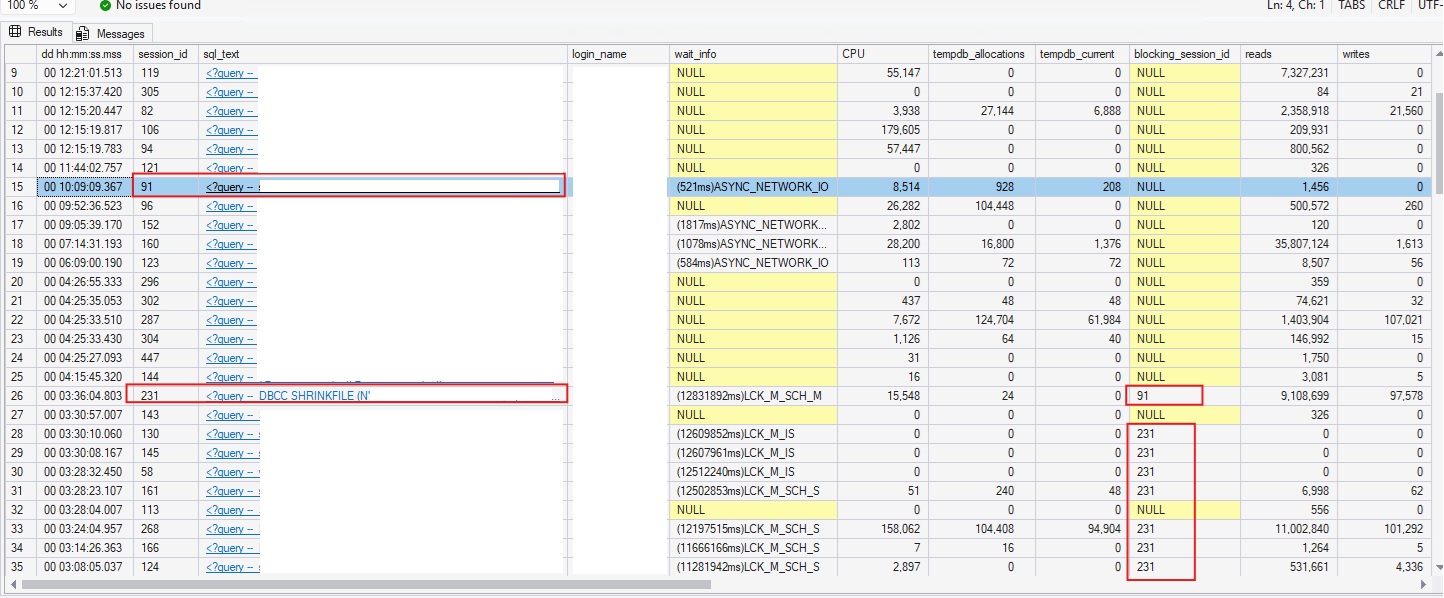
If blocking is the cause, rewriting the query or adding an index may not solve the actual problem.
8. Identify the Root Cause
At this point, you should have enough evidence to develop a hypothesis. Common causes of slow SQL Server queries include:
Missing or Ineffective Indexes
The query may be scanning substantially more data than necessary.
Query Design
The T-SQL itself may be forcing SQL Server to perform unnecessary work.
Execution Plan Regression
A query that previously performed well may have received a less efficient execution plan.
Statistics
Statistics may no longer accurately represent the underlying data.
Parameter Sensitivity
A plan that works well for one parameter value may perform poorly for another.
Blocking
The query may be waiting on another transaction rather than consuming excessive resources itself.
Resource Pressure
CPU, memory, storage, or other resource constraints may be affecting the query.
Data Growth
A query that worked well when a table contained 100,000 rows may behave very differently when the table contains 100 million.
The goal is to identify the actual cause, not simply find something in the execution plan that looks suspicious.
9. Apply a Targeted Fix
Once you have identified the likely cause, make the smallest reasonable change that addresses it. Depending on the problem, that might involve:
- Creating or modifying an index
- Rewriting a query
- Updating statistics
- Addressing parameter sensitivity
- Correcting an execution plan issue
- Resolving blocking
- Adjusting an appropriate SQL Server configuration
- Addressing an underlying storage or resource problem
Don’t Automatically Create Every Missing Index Recommendation
Execution plans can suggest indexes, but those recommendations should be evaluated rather than blindly implemented. Every index has a cost. Indexes consume storage and add overhead to data modification operations such as INSERT, UPDATE, and DELETE.
An index that makes one query faster may make another workload more expensive. Before creating an index, consider:
- How frequently the query runs
- How much improvement is expected
- How much storage the index requires
- How it affects write operations
- Whether an existing index can be modified instead
- Whether other queries would benefit
The best index is the one that solves a real workload problem without creating a larger one elsewhere.
10. Test the Change
After making a change, rerun the query under comparable conditions. Compare the results against your baseline.
For example:
| Metric | Before | After |
| Duration | 38 sec | 2.1 sec |
| CPU | 31 sec | 1.4 sec |
| Logical Reads | 2.4M | 14K |
| Execution Plan | Table Scan | Index Seek |
| Application Response | 42 sec | 3 sec |
That is a meaningful improvement. But don’t stop there. Make sure the change didn’t create problems elsewhere.
Check:
- Other queries using the same tables
- Write performance
- CPU utilization
- Storage usage
- Blocking
- Execution plan stability
- Overall application performance
11. Measure the ROI
Performance tuning should ultimately produce a business benefit. A query becoming faster is useful, but the size and frequency of the improvement determine its actual value. Suppose you reduce a query from 10 seconds to 2 seconds. If it runs twice a day, you’ve saved only 16 seconds per day.
Now consider a query that runs 100,000 times per day and drops from 500 milliseconds to 100 milliseconds. The individual improvement is smaller, but the aggregate savings can be enormous.
Useful measures include:
- Query duration
- CPU consumption
- Logical reads
- I/O
- Execution frequency
- Application response time
- Transaction throughput
- Number of timeouts
- Number of performance-related incidents
For critical workloads, you can translate these improvements into business outcomes such as reduced processing time, improved user productivity, increased throughput, or reduced infrastructure requirements.
12. Monitor the Query After Tuning
A query that performs well immediately after tuning isn’t necessarily going to perform well forever because data, workloads, applications, and SQL Server versions and configurations all change. Continue monitoring the query after the change to make sure the improvement persists.
Query Store can be particularly useful here because it can help you determine whether the query’s performance remains stable and whether a later plan change causes a regression.
What If the Query Is Still Slow?
Sometimes the first tuning attempt doesn’t solve the problem. That’s not necessarily a failure because performance tuning is often an investigation. If the query remains slow, return to the evidence:
- Did the execution plan change?
- Did logical reads decrease?
- Did CPU decrease?
- Are waits still significant?
- Is blocking occurring?
- Is the query waiting on storage?
- Did the workload change?
- Are statistics accurate?
- Is the problem actually outside SQL Server?
Avoid making multiple unrelated changes at once. If you change five things simultaneously, you may improve performance but you likely won’t know which change fixed the problem. Targeted, measurable changes make it much easier to understand what actually worked.
Common SQL Server Query Tuning Mistakes
Even experienced teams can fall into a few common traps.
Tuning Without a Baseline: If you don’t know how the query performed before the change, you can’t reliably measure improvement.
Assuming the Slowest Query Is the Biggest Problem: A query that takes 30 seconds but runs once a day may matter less than a query that takes 200 milliseconds and runs millions of times.
Blindly Creating Indexes: Indexes can improve read performance while also increasing storage requirements and write overhead.
Relying on a Single Metric: CPU, duration, reads, and waits each tell part of the story. Look at them together.
Ignoring Blocking: A query can be slow because it’s waiting, not because its execution plan is inefficient.
Changing Multiple Things at Once: Make targeted changes whenever possible so you can measure their individual effects.
Ignoring the Business Impact: The most technically impressive optimization isn’t necessarily the one that provides the greatest business value.
Frequently Asked Questions
What is SQL Server query tuning?
SQL Server query tuning is the process of analyzing poorly performing queries and making targeted changes to improve their performance. It can involve query rewrites, indexing, statistics, execution plans, configuration, or addressing resource and concurrency issues.
How do I find a slow SQL Server query?
You can identify slow queries through Query Store, SQL Server monitoring tools, Dynamic Management Views, execution information, application logs, or reports from users and application teams. Query Store is particularly useful for identifying historical query performance and plan changes.
How does Query Store help with query tuning?
Query Store retains information about query execution and plans over time, allowing you to compare historical performance. This can help identify query regressions, changes in execution plans, and queries that consume significant resources.
How do I read a SQL Server execution plan?
Start by understanding the operators SQL Server uses to retrieve and process the data. Look for unexpected scans, expensive operations, large differences between estimated and actual rows, excessive reads, memory issues, and other clues. Don’t assume that the operator with the highest percentage is automatically the root cause.
Should I always create a missing index suggested by SQL Server?
No. Missing-index recommendations should be evaluated in the context of the entire workload. Indexes consume storage and can increase the cost of INSERT, UPDATE, and DELETE operations.
How do I know if a query-tuning change worked?
Compare the query’s performance before and after the change under comparable conditions. Look at duration, CPU, logical reads, I/O, waits, execution plans, and application response time. Continue monitoring afterward to make sure the improvement persists.
How long does SQL Server query tuning take?
It depends on the problem. A simple indexing issue may be resolved quickly, while complex performance problems involving execution plans, blocking, application behavior, or resource contention can require substantially more investigation.
Is query tuning the same as a SQL Server Health Check?
No. Query tuning focuses on improving specific performance problems. A SQL Server Health Check takes a broader look at the overall environment, including performance, configuration, storage, security, backups, capacity, and availability.
Related Articles
Need Help With SQL Server Query Tuning?
Finding a slow query is often the easy part. Determining why it’s slow, identifying the right fix, and proving that the fix actually improved the workload can require a much deeper analysis.
SQL Solutions Group helps organizations diagnose and resolve SQL Server performance problems using query analysis, execution plans, performance metrics, and hands-on SQL Server expertise. Our goal isn’t simply to make one query faster—we help identify the underlying issues that can affect the performance and reliability of the broader SQL Server environment.