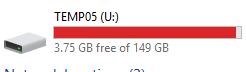
Ever had a situation where you’re rebuilding a large index but when you check sp_whoisactive, you see 0% complete … and you know the system is just lying to you?
We recently had a scenario where we were rebuilding a large index for a customer over a long weekend. We were monitoring closely, as this has caused production issues in the past. After 2.5 hours, we did not see any progress on the rebuild.
For full visibility, this rebuild was being performed by the Ola Hallengren index optimize stored procedure and was using this command (anonymized):
ALTER INDEX [IndexName] ON [dbo].[TableName] REBUILD WITH (SORT_IN_TEMPDB = OFF, ONLINE = ON, MAXDOP = 8, FILLFACTOR = 100, RESUMABLE = OFF)
This is what we see in sp_whoisactive, we were not blocked, we were not waiting on any resources but our % completion is at 0 still.

Are We Making Progress?
We can go directly to the source if we choose and query sys.dm_exec_requests to check our progress from there.
SELECT

r.session_id,

r.status,

r.command,

r.blocking_session_id,

r.wait_type,

r.wait_time / 1000.0 AS wait_seconds,

r.wait_resource,

r.total_elapsed_time / 1000.0 AS elapsed_seconds,

r.percent_complete

FROM sys.dm_exec_requests AS r

WHERE r.session_id = /*your spid*/;
However we see 0% here too:

The reason is actually interesting. The official documentation does state that the percent_complete column does not include index rebuilds, but rather only index reorgs (and other not directly related commands).

So that explains our predicament here: This DMV just doesn’t provide data for rebuilds like ours. Because of this we’re going to have to look at different options.
Pursuing Options
Luckily, we’re on a new enough version of SQL Server that we have lightweight query profiling enabled:
SELECT name, value, value_for_secondary

FROM sys.database_scoped_configurations

WHERE name = 'LIGHTWEIGHT_QUERY_PROFILING';

Because of this, we can use sys.dm_exec_query_profiles to see how far along the query believes itself to be.
SELECT

qp.node_id,

qp.physical_operator_name,

qp.row_count,

qp.estimate_row_count,

CAST(qp.row_count AS DECIMAL(18,2))

/ NULLIF(qp.estimate_row_count, 0) * 100 AS pct_complete_by_rows,

qp.elapsed_time_ms / 1000.0 AS elapsed_seconds,

qp.cpu_time_ms / 1000.0 AS cpu_seconds

FROM sys.dm_exec_query_profiles AS qp

WHERE qp.session_id = /*your spid here */

ORDER BY qp.node_id;
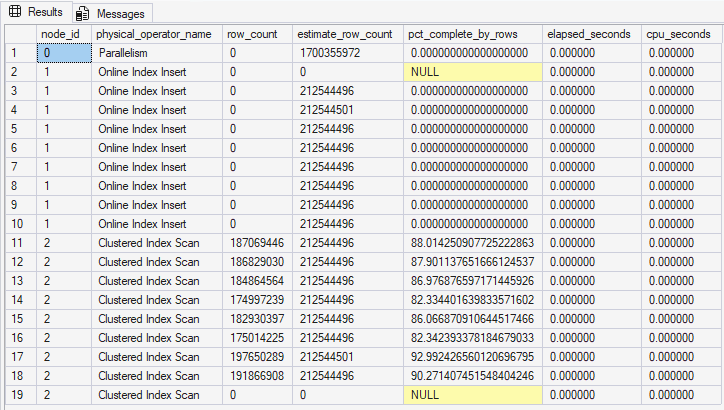
As we’re running with a MAXDOP of 8, we can see the separate threads here and their individual progress.
It’s worth making clear that these are estimated row counts, not actuals. They are only as good as your statistics on these tables are. However, when I ran this again a few minutes later, we can see that our parallel threads are still making progress and not stuck at 0% as we were, at first, lead to believe:

Notice that a couple of threads are over 100% completion. That’s due to statistics that aren’t quite right and the actual row counts are above that.
We can make this query a little more concise if we choose:
SELECT

qp.node_id,

qp.physical_operator_name,

SUM(qp.row_count) AS total_rows_processed,

SUM(qp.estimate_row_count) AS total_estimated_rows,

CAST(SUM(qp.row_count) AS DECIMAL(18,2))

/ NULLIF(SUM(qp.estimate_row_count), 0) * 100 AS pct_complete,

SUM(qp.elapsed_time_ms) / 1000.0 AS elapsed_seconds,

SUM(qp.cpu_time_ms) / 1000.0 AS cpu_seconds

FROM sys.dm_exec_query_profiles AS qp

WHERE qp.session_id = 468

GROUP BY qp.node_id, qp.physical_operator_name

ORDER BY qp.node_id;

</ br>
Lies, Damn Lies, and Statistics
</ br>
If SQL Server is doing something you can’t decipher, we’d love to help! Put our 90+ years of combined SQL Server experience to work for you.