If you’ve followed along with the previous blog, you’ll now have a way to re-run and test your query as well as measuring any changes. The next part, which this blog addresses, is identifying problem statements in the code causing the issues. With that awareness, we will know where to focus our tuning efforts.
Locating Problems
There are two different types of queries that we’ll cover here, Single Statement and Multi Statement. The main difference is that single statement queries contain one block of T-SQL, whereas multi statement queries contain multiple distinct blocks of T-SQL. Think of a stored procedure that does more than one operation within it.
Multi Statement Queries
These types of queries require a little more effort to troubleshoot, as we don’t necessarily know which statement is causing our performance issues. Narrowing this down is an extra step that’s required but not actually that complicated in most scenarios.
I’m using the Stack Overflow database for these examples. Brent Ozar’s site has download instructions if you want to test these queries yourself. I’m using the largest possible download, but you don’t need to do this for the theory here.
I visited the stack overflow data explorer and picked the first 3 queries that I found. Here’s our test (I have formatted these queries to be compact rather than beautiful);


SET STATISTICS TIME,IO ON

DECLARE @UserId INT = 22656

SELECT

COUNT(a.Id) AS [Accepted Answers],

SUM(CASE WHEN a.Score = 0 THEN 0 ELSE 1 END) AS [Scored Answers],

SUM(CASE WHEN a.Score = 0 THEN 1 ELSE 0 END) AS [Unscored Answers],

SUM(CASE WHEN a.Score = 0 THEN 1 ELSE 0 END)*1000 / COUNT(a.Id) / 10.0 AS [Percentage Unscored]

FROM Posts q

INNER JOIN Posts a ON a.Id = q.AcceptedAnswerId

WHERE a.CommunityOwnedDate IS null

AND a.OwnerUserId = @UserId

AND q.OwnerUserId != @UserId

AND a.postTypeId = 2

SELECT

COUNT(*) AS CommentCount,

Score

FROM Comments

WHERE UserId = @UserId

GROUP BY Score

ORDER BY Score DESC

SELECT (CAST(COUNT(a.Id) AS FLOAT) / (SELECT COUNT(*) FROM Posts WHERE OwnerUserId = @UserId AND PostTypeId = 2) * 100) AS AcceptedPercentage

FROM Posts q

INNER JOIN Posts a ON q.AcceptedAnswerId = a.Id

WHERE a.OwnerUserId = @UserId AND a.PostTypeId = 2
It’s a variable for @UserId and three separate select queries. Our baseline statistics here look like this (formatted in StatisticsParser.com):
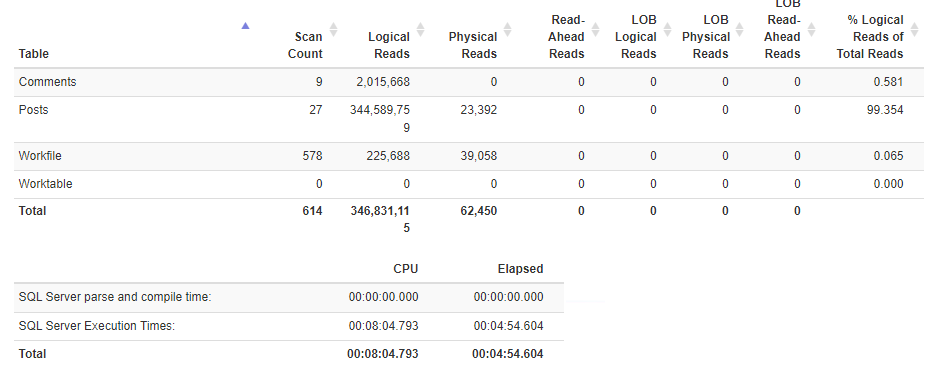
We can see that we’re doing 346 million logical reads and had a total execution time of 4 minutes 54 seconds.
The question we need to ask ourselves is: Which of the statements above are performing poorly? It could be multiple of them or none of them. We just don’t have the information yet, so let’s get that data.
Quick and Dirty – Print Statement
This is a quick and easy way of testing how long each statement is taking and is super simple. It’s a very useful way of getting data quickly but has downsides. By doing this we will have to manually save off the information; otherwise we’re going to lose it and have no way to compare each run together.
The way to do this is to put a PRINT between each statement in this query. We want to be able to identify each PRINT and gather the date and time that it was executed. This way we’ll be able to compare them to each other and work out how long each step takes. It would look something like this:
PRINT ('PRINT 1 - ' + CONVERT(VARCHAR,GETDATE(),21))

DECLARE @UserId INT = 22656

PRINT ('PRINT 2 - ' + CONVERT(VARCHAR,GETDATE(),21))

SELECT

COUNT(a.Id) AS [Accepted Answers],

SUM(CASE WHEN a.Score = 0 THEN 0 ELSE 1 END) AS [Scored Answers],

SUM(CASE WHEN a.Score = 0 THEN 1 ELSE 0 END) AS [Unscored Answers],

SUM(CASE WHEN a.Score = 0 THEN 1 ELSE 0 END)*1000 / COUNT(a.Id) / 10.0 AS [Percentage Unscored]

FROM Posts q

INNER JOIN Posts a ON a.Id = q.AcceptedAnswerId

WHERE a.CommunityOwnedDate IS null

AND a.OwnerUserId = @UserId

AND q.OwnerUserId != @UserId

AND a.postTypeId = 2

PRINT ('PRINT 3 - ' + CONVERT(VARCHAR,GETDATE(),21))

SELECT

COUNT(*) AS CommentCount,

Score

FROM Comments

WHERE UserId = @UserId

GROUP BY Score

ORDER BY Score DESC

PRINT ('PRINT 4 - ' + CONVERT(VARCHAR,GETDATE(),21))

SELECT (CAST(COUNT(a.Id) AS FLOAT) / (SELECT COUNT(*) FROM Posts WHERE OwnerUserId = @UserId AND PostTypeId = 2) * 100) AS AcceptedPercentage

FROM Posts q

INNER JOIN Posts a ON q.AcceptedAnswerId = a.Id

WHERE a.OwnerUserId = @UserId AND a.PostTypeId = 2

PRINT ('PRINT 5 - ' + CONVERT(VARCHAR,GETDATE(),21))
PRINT will output to your messages tab in your results. For this example I have turned off the statistics collection and set nocount = on to make it easier to read.
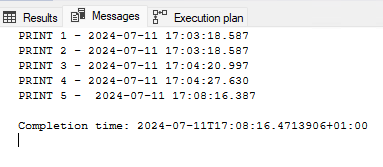
You can see that the job began at 17:03:18 and finished at 17:08:16 which is a total run time of 4 minutes 58 seconds. When we compare the prints against the previous step we get the following durations:
- Print 1: query start
- Print 2 duration: 0 seconds
- Print 3 duration: 2 seconds
- Print 4 duration: 7 seconds
- Print 5 duration: 3 minutes 49 seconds
Again, this is a rough and dirty calculation and gets complicated the more statements there are. But it can give a quick result which can be very handy in a situation when you’re trying to fix an ongoing performance issue. From the data above we can see that the code between the Print 4 and Print 5 statements is taking the longest amount of time and that’s where we should probably start our tuning efforts.
More Professional – Insert into Logging Table
There is a more elegant way of doing, this but it’s going to require a little more effort to set up. The upside is, once it’s done you can re-use the objects we’re going to create.
The issue with PRINT statements is that the data doesn’t persist. Plus, we have to do manual calculations on the times to find out how long each step takes. We’re data professionals, so let’s do this properly!
First of all, let’s create a table for logging. This one below is very simple, feel free to make any changes you like to make it work for you. We use the SSG database for things like this, feel free to use any suitable database that you have available.
CREATE TABLE SSG.dbo.PerfLogging

(

ID INT IDENTITY(1,1) PRIMARY KEY CLUSTERED

,StatementName NVARCHAR(100)

,StatementStartTime DATETIME

,StepName NVARCHAR(100)

,StepStartTime DATETIME

)

Once we have this we can REPLACE our previous PRINT statements.

We’ll need TO DECLARE two variables FOR this logging, this IS so we know what we’re tuning and what TIME we began the TRANSACTION.

DECLARE @StatementName NVARCHAR(100) = 'StackOverflowDemo'

,@StatementStartTime DATETIME = GETDATE()

Once these ARE in place we will now change the PRINT statements INTO INSERT statements. They’ll look something like this;

INSERT INTO SSG.dbo.PerfLogging (StatementName, StatementStartTime, StepName, StepStartTime)

VALUES (@StatementName, @StatementStartTime, 'Step 1', GETDATE())
The first two variables are the ones we just declared which give us our code name and overall start time. The second two are the step name and the step time.
Once we have these in place we can run our code. When complete, we can see the data in our logging table:
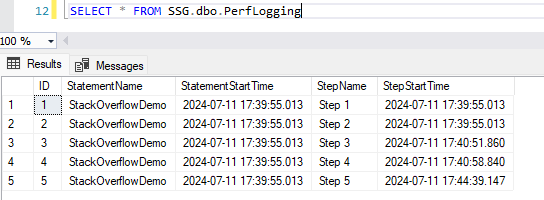
You can see the start time for the whole proc was 17:39:55 and the final step completed at 17:44:39. This is the same data that we gathered in the PRINT statements. But now we can do so much more with it. Let’s make a view that will calculate the duration of each step as well as showing us multiple runs of the same query.
Let’s make a simple view that will give us the durations;
USE SSG

GO

CREATE VIEW dbo.PerfLoggingDurations

AS

SELECT

StatementName

,StatementStartTime

,StepName

,StepStartTime

,DATEDIFF(SECOND,NULLIF(LAG(StepStartTime,1,0) OVER (PARTITION BY StatementName, StatementStartTime ORDER BY ID ASC), '1900-01-01 00:00:00.000'),StepStartTime) DurationSecs

FROM SSG.dbo.PerfLogging
We’re using the LAG function to gather the time of the previous step and calculating the amount of seconds between these two times.
Once you created this, the results will look something like this:
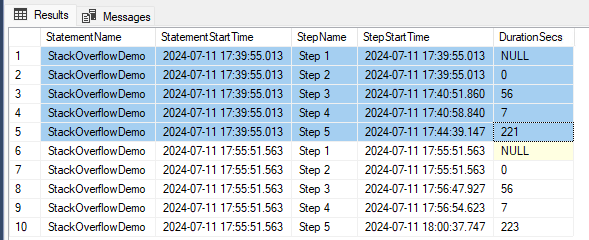
You can see based upon the StatementStartTime that there are two separate runs of the same query in here and the durations of each of these steps. This is very helpful to see the changes between each iteration of the performance tuning. If you’re smart, you’ll notice that you can change the statement name to include a description of what you changed. This will make the data even more useful when you come to it tomorrow and have forgotten everything you have done today!
Single Statement Queries
With these types of queries, you don’t have to find out which statement is the problem; there’s only one. It’s still a great idea to log the data for these statements to a table. Having extra data in this situation is only going to be a good thing.
I’d also heavily suggest having a logging table like this in a non-production database to log to. After all, this isn’t going to be the last time you have to performance tune a query.
Now, On To Tuning!
After this look at identifying problem statements, our next blog post — part 3 — will be a walkthrough of how to begin performance tuning your queries. We’ll look at common issues and techniques on how to make them go faster.


This Post Has One Comment
Pingback: Common Performance Problems with SQL Server | SQL Solutions Group