In Part I of Check for Errors First, we discovered how to query the error logs, and filter out the noise to find meaningful errors that could contribute to performance and stability issues. Today we are going to dive a little deeper and look for SQL errors generated for our analysis outside the SQL error logs.
There is a little known fact that a lightweight black box (or “default”) trace runs continually whenever SQL Server starts—unless it is turned off. This default trace was introduced in SQL 2005, and is packaged today with SQL 2014. The configuration can be changed, but it comes with five rollover files that are 20mb each and reside in the same location as the SQL server error log files. This instructional tutorial will walk you through the process of understanding the “default” trace files, as well as delivering a simple solution to provide the errors for analysis.
First, we need to know if the trace file is in fact running. We find this information in sys.configurations, which contains a row for each server-wide configuration option in the system.
SELECT *
FROM [sys].[configurations]
WHERE [name] = 'default trace enabled';If the value column does not equal one, then the default trace has been turned off and we have to turn it on with the following code.
SP_CONFIGURE 'show advanced options', 1;
GO
RECONFIGURE;
GO
SP_CONFIGURE 'default trace enabled', 1;
GO
RECONFIGURE;
GO
Now that we know the default trace is running, lets get some details about the trace from the sys.traces catalog view. If you already know the traceid you can retrieve most of the same information by leveraging the system function fn_trace_getinfo.
SELECT [id]
,REVERSE(SUBSTRING(REVERSE([PATH])
, CHARINDEX('\', REVERSE([path])), 256))
,[Status]
,[max_size]
,[max_files]
FROM [sys].[traces]
WHERE [is_default]      = 1;
We see that the Default Trace has a traceid of 1, we have the location of the path where the log files are located, and we can quickly check the status, size, and number of files. This is what we need to complete our solution, but lets take a quick sidestep to understand what is in the Default trace, which will help us later in our end solution to filter out the noise we are not concerned with.
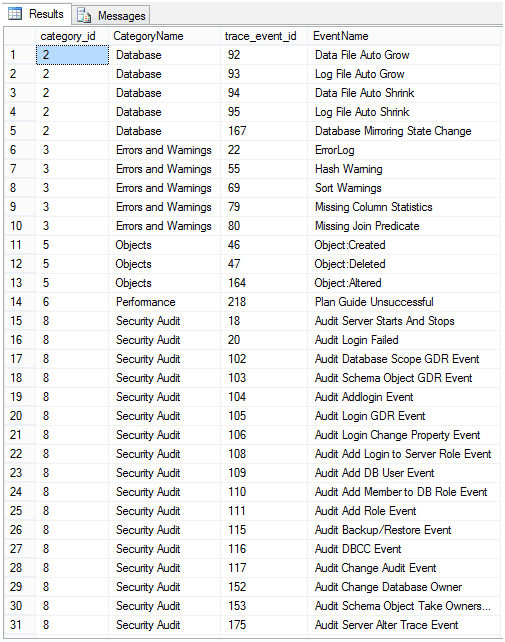
If we execute the code below we will return a result set that lists the categories and events that make up our trace:
SELECT DISTINCT c.[category_id]
,c.[Name]                AS CategoryName
,b.[trace_event_id]
,b.[name]                AS EventName
FROM FN_TRACE_GETEVENTINFO(1)  a
JOIN [sys].[trace_events]      b
ON a.[eventid]             = b.[trace_event_id]
JOIN [sys].[trace_categories]  c
ON b.[category_id]         = c.[category_id]
ORDER BY c.[category_id]
,b.[trace_event_id]
The scope of this project is only concerned with the category “Errors and Warnings”, but you can see that you can get much more information here, like who has changed an object, altered security, data file growth/shrinking, and some performance events. I have seen administrators leverage the Default Trace’s Security Audit to determine when an environment changed when DDL triggers were not invoked.
Once we know these simple attributes that essentially define the trace, we can write a simple query to return just the errors from the Default Trace:
SELECT c.name AS CategoryName
,te.name AS EventName
,tsv.[subclass_name]
,a.[StartTime]
,a.[DatabaseName]
,a.[ApplicationName]
,a.[TextData]
FROM dbo.FN_TRACE_GETTABLE((SELECT REVERSE(SUBSTRING(
REVERSE(PATH),
CHARINDEX('\',
REVERSE(path)
), 256
)
) + 'LOG.trc'
FROM sys.traces
WHERE [is_default] = 1
), DEFAULT) a
JOIN [sys].[trace_events] te
ON a.[EventClass] = te.[trace_event_id]
JOIN [sys].[trace_categories] c
ON te.[category_id] = c.[category_id]
JOIN sys.trace_subclass_values tsv
ON a.[EventClass] = tsv.[trace_event_id]
AND a.[EventSubClass] = tsv.[subclass_value]
WHERE c.name = 'Errors and Warnings';
There is not much going on in the first part of the query; the SELECT clause is pretty straight forward. The FROM clause has the most going on, but is not that complicated when we break it down. First, we are using the function fn_trace_gettable, which does most of the heavy lifting, returning the result set from the actual logs. There is more than one log file here so we get a little fancy and set the parameter going in as a path to the log files with a wild card log.trc at the end (this is specific to the table function fn_trace_gettable).
What makes it look so busy is the fact that we are using SUBSTRING to take part of the path from sys.traces and concatenating the string all within the function call. The rest of the query is very straightforward with the JOIN criteria and the WHERE filter to choose only the “Errors and Warnings”, and the result set is just the errors that we can analyze for performance and stability for our system.
As this illustrates, whenever you check for errors, SQL Server’s default trace can be a useful tool in your searching.


