This is part three of the blog series on following a structure when performance tuning. From the previous posts (part 1, part 2) we have our problem queries along with baselines, statistics, and query plans to help us move in the right direction. Now we can tackle common performance problems with SQL Server.
Query Plans
First thing we’ll do is look through the query plan to see if we can see any obvious errors. I highly recommend downloading Sentry One Plan Explorer to view these plans. It’s a free tool that gives more information for tuning. If you can only use SSMS in your environment that is totally fine. But the screenshots I’ll be using will be from Plan Explorer.
We’re using the Stack Overflow database if you want to play along at home; download it from Brent Ozar’s site here. The queries below are using the 200GB version as of 2024-04.
The query below is taken from one of the more popular queries on the data.stackexchange.com board. It’s designed to show a user’s accepted answer percentage rate. The UserId parameter here is my own profile; feel free to replace this with your own.


DECLARE @UserId INT = 6194235

SELECT

(CAST(COUNT(a.Id) AS FLOAT) / (SELECT COUNT(*) FROM Posts WHERE OwnerUserId = @UserId AND PostTypeId = 2) * 100) AS AcceptedPercentage

FROM Posts q

INNER JOIN Posts a ON q.AcceptedAnswerId = a.Id

WHERE a.OwnerUserId = @UserId

AND a.PostTypeId = 2
The first thing to check here is any operators in the plan that have a high % of the overall total query cost. You can likely tune this area. Bear in mind, we’re using actual query plans here, not estimates. This will become relevant soon.
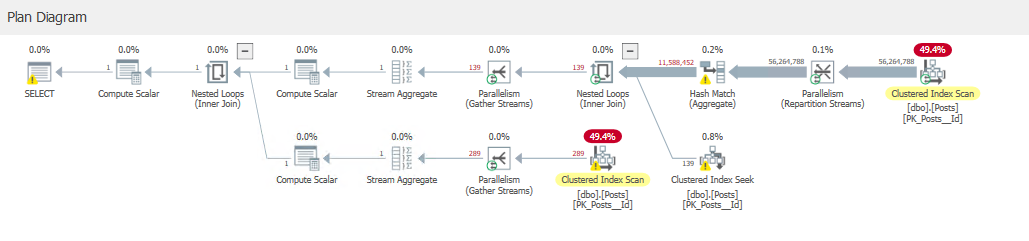
Clustered Index Scans
As you can see, the query performs two Clustered Index Scans. Both are reporting almost 50% of the overall cost. In general, a scan is less effective than a seek and usually requires reading more rows worth of data.
This gives us an idea on where we want to look, but not necessarily a solution. In general, clustered index scans indicate that we don’t have a supporting index for this particular query so we’re just having to perform a scan of the table in general.
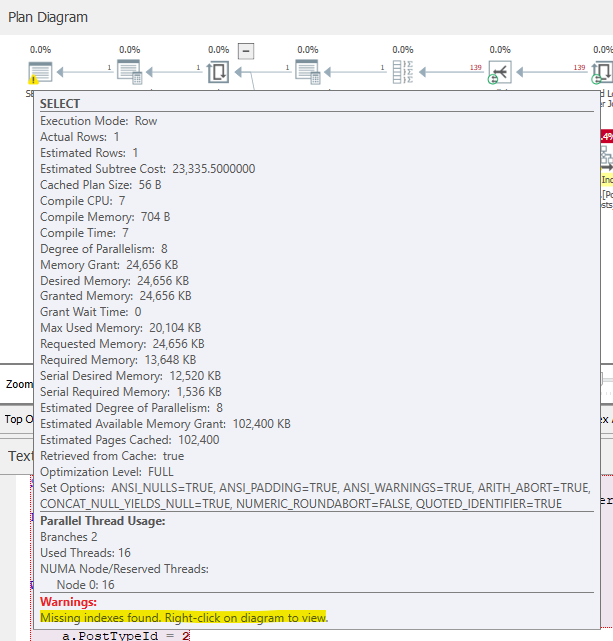
You’ll notice a yellow warning symbol on the final select statement on the left side of the screen. If we hover over that we will also get some plan warnings.
Another common issue we see with clustered index scans is joining two tables on fields with different data types. SQL needs them to exactly match in order to join effectively. If they do not match — e.g. varchar(100) vs nvarchar(100) — then the engine will need to convert one to match the other before attempting the join. This is going to cause a full table scan on one side of the join, which (as might guess) is very bad for performance in general. To resolve or prevent this, ensure data types match on fields that you are joining them on.
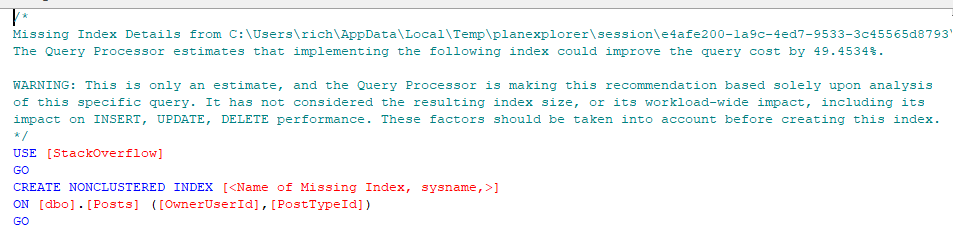
You’ll see here that the execution plan is reporting some missing indexes. If we drill down into it, we get the above message. It estimates that this index would improve the query cost by 49%. The thing to remember here is that the order of the fields suggested by the optimizer (OwnerUserId, PostTypeId) are in the order as they exist within the table, not necessarily the best, so don’t just blindly apply these indexes. Investigate if you have any similar indexes that you could modify, and ensure they are designed with the query in mind.
Data Volumes
Another thing to look out for (and another reason why plan explorer is so handy) is the thickness of the lines connecting different operators. The thicker the line, the more data is coming down the pipe.
In the execution plan we’re looking at here, you can see that we’re reading 56 million rows from the Posts table before joining to the Posts table again and filtering down to 139 rows of data. This is also an indication of poorly optimized indexes.
The reason we’ll want to tune this is simply the amount of effort the database will have to expend in order to execute the query; obviously, the lower the better. As mentioned, you can often fixed this by indexing. With more complex queries, you can use techniques such as pushing down predicates to reduce data volumes as early as possible.
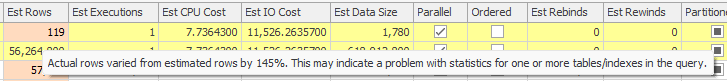
Top Operators
Sentry will also highlight the most expensive operations in a separate tab.
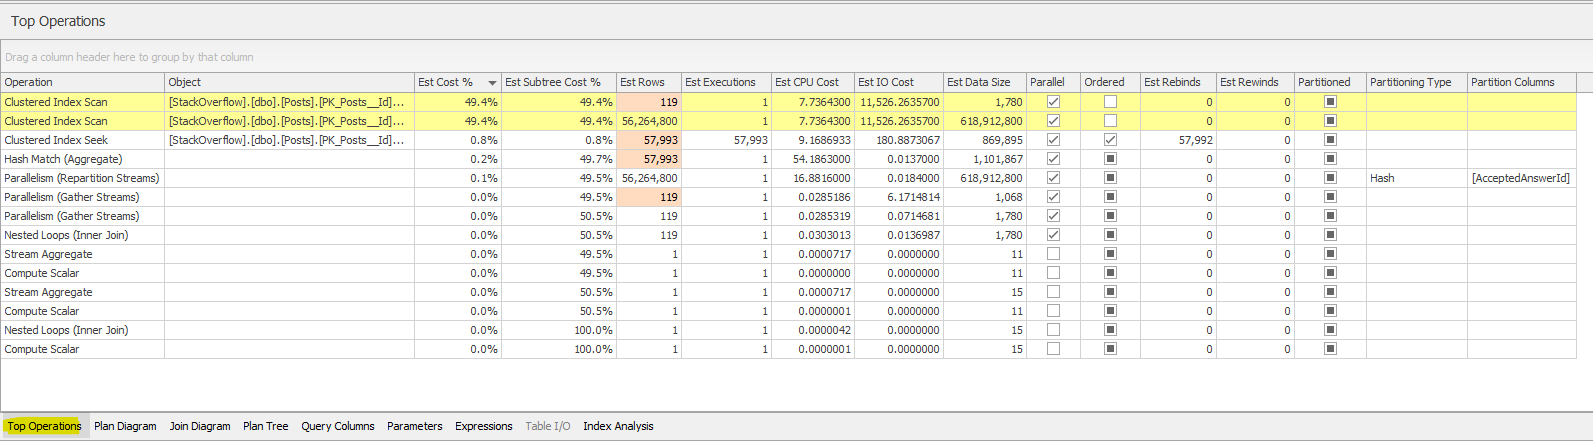
This will show you some useful information around estimates vs actual values. This is why it was important we got the actual query plan, not just the estimate. If these are wildly different, it could indicate an issue with out-of-date statistics. Try running an update stats job to see if that helps (and check if you have a regular stats maintenance, because you really should).
If you hover over any red cells it will give you a hint that this is the case too.
Wait Stats
A query will incur wait statistics anytime it has to wait on a resource. These are broken down into hundreds of different wait stats so we won’t go through them all here. But if you view the XML of your execution plan, there will be a section which indicates the wait stats that were incurred on this query
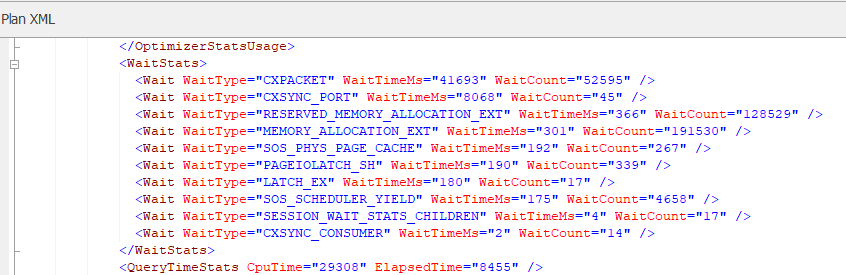
Your results are likely to be different, as this will depend on your own system and its workload, but in my scenario you can see the MEMORY_ALLOCATION wait stats are significant. You’re not likely to see this on a production server, as this is when SQL is waiting to allocate memory. We’re only seeing that because this is running on my local machine.
These stats can be extremely useful, in the example above. In my example, you can see PAGEIOLATCH waits (which would indicate blocking), and SOS_SCHEDULER_YIELD (which indicates CPU contention).
I’d recommend reviewing your wait stats, noting the highest waits, and then investigating these one by one. Check if any of them are concerning for your query and if you can do anything to relieve the pressure they cause.
Things you won’t capture
There are certain operations that won’t appear on execution plans, code that happens outside of this transaction. Things like Scalar Functions and Triggers are treated as their own transactions. These usually perform poorly and are near invisible when investigating execution plans. You’ll have to either spot functions in the code or look at the tables directly for triggers
Conclusion
You should now have all of the tools you need to put structure into your query tuning. Now you can really dig into (and resolve) these common performance problems. By gathering the statistics and analyzing each part of the data, you can really find out where a query is struggling. This is also a great way to dive into performance tuning as you can learn each part on its own and dive deeper into each of them.


